-
Generalized Extreme Studentized Deviate test(ESD) 이상치 탐지Study/통계 2020. 3. 13. 13:05
Generalized Extreme Studentized Deviate test는 일변량 데이터에서 하나 이상의 이상치를 탐지하는데 사용됩니다.
Grubb's test의 한계는 특이치의 개수를 정확히 지정해야 한다는 것입니다. 만일에 특이치의 개수 k가 정확히 지정되지 않으면 결과가 왜곡될 수 있습니다. 그러나 Generalized ESD test는 의심되는 이상치 수의 상한을 지정하기만 하면 됩니다.
상한치 r이 주어지면 Generalized ESD test는 r번의 테스트를 수행합니다. 하나의 특이치에 대한 테스트, 두개의 특이치에 대한 테스트, 최대 r개의 특이치에 대한 테스트를 합니다.
Generalized ESD test는 다음과 같은 가설을 정의합니다.
Generalized ESD test의 귀무가설은 '데이터 셋에 특이치가 없다'입니다.
Generalized ESD test의 대립가설은 '데이터 셋에 최대 r개의 특이치가 있다'입니다.
검정 통계량은 아래와 같습니다.
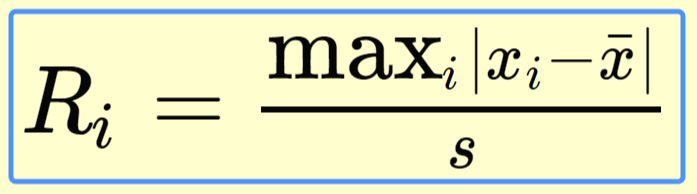
https://www.itl.nist.gov/div898/handbook/eda/section3/eda35h3.htm x바와 s는 각 표본 평균과 표본 표준 편차를 나타냅니다.
r개의 검정 통계량이 관측될 때 까지 관측치와 표본평균의 절대 편차의 최대값을 구하고 해당하는 x값을 데이터 셋에서 하나씩 제거하면서 r개의 검정 통계량을 구합니다.
유의수준은 α입니다.
임계치는 아래와 같습니다.

https://www.itl.nist.gov/div898/handbook/eda/section3/eda35h3.htm 여기서 t(p, ν)는 ν 자유도를 가진 t 분포 에서 100 p 백분율 포인트입니다.
여기서 p는 아래와 같습니다.
p = 1 - α/2(n-i+1)
이상치의 개수는 아래식을 만족하는 가장 큰 i 찾으면 됩니다.

Rosner의 시뮬레이션 연구에 따르면이 임계 값 근사는 n ≥ 25에 대해 매우 정확하고 n ≥ 15에 대해 상당히 정확합니다 .
Generalized ESD test는 Grubb's test가 순차적으로 적용되지만 몇가지 중요한 차이점이 있습니다.
1. 예상되는 이상치의 개수에 따라 critical value를 적절하게 조절합니다.
2. 상당한 마스킹이있는 경우 Grubb's test를 순차적으로 적용하면 너무 빨리 중지 될 수 있습니다. 아래 예는 Generalized ESD test를 사용할 때 5% 수준에서 3 개의 이상치를 식별합니다. 그러나 Grubb's test를 순차적으로 사용하면 첫 번째 반복에서 중지되고 이상 값을 선언하지 않습니다.
-0.25 0.68 0.94 1.15 1.20 1.26 1.26 1.34 1.38 1.43 1.49 1.49 1.55 1.56 1.58 1.65 1.69 1.70 1.76 1.77 1.81 1.91 1.94 1.96 1.99 2.06 2.09 2.10 2.14 2.15 2.23 2.24 2.26 2.35 2.37 2.40 2.47 2.54 2.62 2.64 2.90 2.92 2.92 2.93 3.21 3.26 3.30 3.59 3.68 4.30 4.64 5.34 5.42 6.01
아래는 Generalized ESD test의 Python 코드입니다.
우선 필요한 패키지들을 import 합니다.
import matplotlib.pyplot as plt
import numpy as np
import pandas as pd
import scipy.stats as stats
Jupter notebook 내에서 실행될 수 있도록 inline 처리를 합니다.%matplotlib inline이상치를 포함한 배열 Y를 생성합니다. 여기서 이상치에 해당하지 않는 데이터의 경우 정규분포를 따라야 합니다.
y = np.random.random(100)
x = np.arange(len(y))
산점도를 찍으면 아래와 같이 나옵니다.
plt.scatter(x,y)
y[14] = 9
y[83] = 10
이상치를 넣은 후 산점도를 그립니다.
plt.scatter(x,y) Grubb's test 입니다.
def grubbs_stat(y):
    std_dev = np.std(y)
    avg_y = np.mean(y)
    abs_val_minus_avg = abs(y - avg_y)
    max_of_deviations = max(abs_val_minus_avg)
    max_ind = np.argmax(abs_val_minus_avg)
    Gcal = max_of_deviations/ std_dev
    print("Grubbs Statistics Value : {}".format(Gcal))
    return Gcal, max_ind
임계치를 구하는 함수입니다.
def calculate_critical_value(size, alpha):
    t_dist = stats.t.ppf(1 - alpha / (2 * size), size - 2)
    numerator = (size - 1) * np.sqrt(np.square(t_dist))
    denominator = np.sqrt(size) * np.sqrt(size - 2 + np.square(t_dist))
    critical_value = numerator / denominator
    print("Grubbs Critical Value: {}".format(critical_value))
    return critical_value
임계치와 검정통계량을 비교합니다.def check_G_values(Gs, Gc, inp, max_index): if Gs > Gc: print('{} is an outlier. G > G-critical: {:.4f} > {:.4f} \n'.format(inp[max_index], Gs, Gc)) else: print('{} is not an outlier. G > G-critical: {:.4f} > {:.4f} \n'.format(inp[max_index], Gs, Gc))Generalized ESD test 입니다.
def ESD_Test(input_series, alpha, max_outliers):
    for iterations in range(max_outliers):
        Gcritical = calculate_critical_value(len(input_series), alpha)
        Gstat, max_index = grubbs_stat(input_series)
        check_G_values(Gstat, Gcritical, input_series, max_index)
        input_series = np.delete(input_series, max_index)
유의수준 0.05에서의 r을 3으로 설정합니다. Generalized ESD test을 한 결과를 봅니다.
ESD_Test(y, 0.05, 3)이상치로 설정한 값들은 이상치라고 하며 아닌 값은 아니라고 합니다.
원본 코드 출처 : https://github.com/bhattbhavesh91/outlier-detection-grubbs-test-and-generalized-esd-test-python/blob/master/generalized-esd-test-for-outliers.ipynb
'Study > 통계' 카테고리의 다른 글
머신러닝을 위한 Probability and Distribution 알아보기 (0) 2020.05.29 MLE(Maxinum Likelihood Estimation)에 대한 이해 (0) 2020.05.28 MAP - Maximum a Posteriori 최대 사후 확률 (0) 2020.05.07 Grubb's test 이상치 탐지 (0) 2020.03.12 Median Absolute Deviation(MAD) (0) 2020.03.12